Back to Course

SS1: ECONOMICS - 1ST TERM

0% Complete
0/0 Steps
  1. Introduction to Economics | Week 1
    3 Topics
    |
    1 Quiz
  2. Basic Concept of Economics | Week 2
    4 Topics
    |
    1 Quiz
  3. Basic Tools for Economic Analysis | Week 3
    8 Topics
    |
    1 Quiz
  4. Measure of Central Tendency | Week 4
    4 Topics
    |
    1 Quiz
  5. Theory of Demand & Supply I | Week 5
    5 Topics
    |
    1 Quiz
  6. Theory of Demand & Supply II | Week 6
    7 Topics
    |
    1 Quiz
  7. Theory of Production I | Week 7
    7 Topics
    |
    1 Quiz
  8. Theory of Production II | Week 8
    4 Topics
    |
    1 Quiz
  9. Basic Economic Problems of the Society | Week 9
    1 Topic
    |
    1 Quiz
  10. Economic System | Week 10
    4 Topics
    |
    1 Quiz
  • excellence
  • Follow

Lesson Progress
0% Complete

Topic Content:

  • Definition of Bar Chart
  • Types of Bar Chart

A bar chart is a series of rectangles, whose widths are equal, and whose heights are proportional to the value they represent. The bars are separated from one another by equal space. Bar charts show the changes in the figures of the variables.

Types of Bar Chart:

1. Simple Bar chart.
2. Components Bar Chart.
3. Multiple Bar Charts.

Simple Bar Chart:

Simple bar charts are bars of various height that represents data with different values or figures. It is a type of bar chart that doesn’t have different parts. 
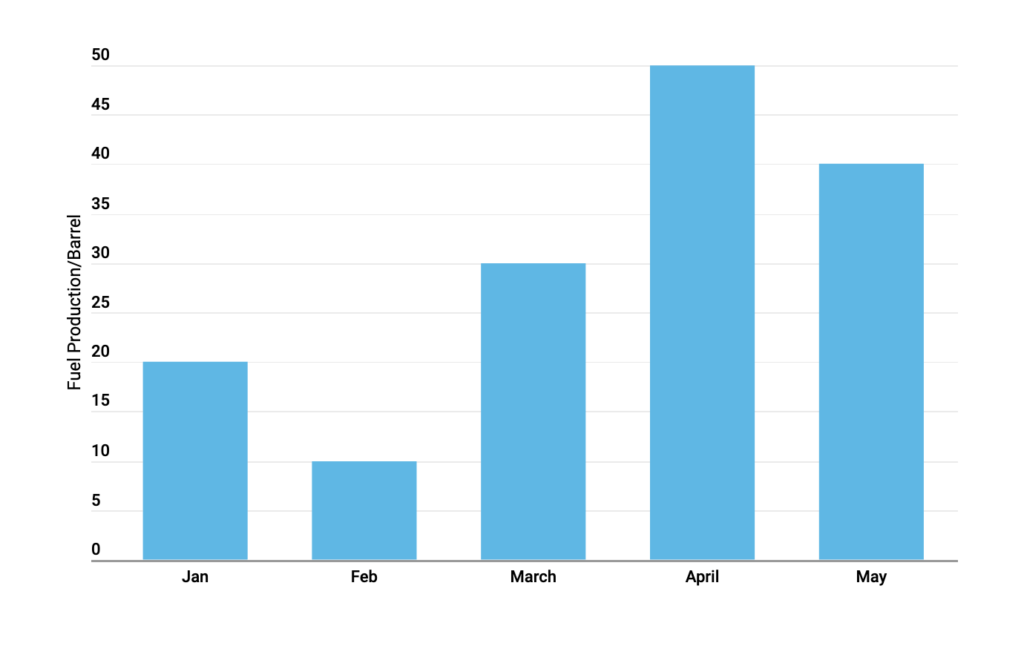
bar chart 2

Component Bar Charts:

Component bar charts are charts showing information with various portions, or components, and each of the bars is proportional to the figure, or value represented. Component bar charts involve data that constitutes part of more than one category, and each bar is divided into portions according to the magnitude they represent.

Screenshot 2023 09 18 at 04.47.48

Multiple Bar Charts:

This type of bar chart represents multiple bars, and each bar stands proportionate, to the value or figure under consideration. Multiple bar chart values are drawn in separate bars, and touch one another in a set or group of data. It is also called a Compound Bar Chart. It enables us to compare items within a given period.

Screenshot 2023 09 18 at 04.37.38
avatar
Subscribe
Notify of
guest
0 Comments
Oldest
Newest
Inline Feedbacks
View all comments
0
Would love your thoughts, please comment.x
()
x