Topic Content:
- Definition of Pie Chart
- Example of Pie Chart
What is a Pie Charts?
A pie chart is a circular structure divided into sectors, which is proportional to the value represented. It is a circular structure, in such a way that, each proportion of the circle, represents a given component, of the data and figure under consideration.
A circle is divided into sections to represent the total data, the value is in degree or percentage which is 360 degrees or 100%.
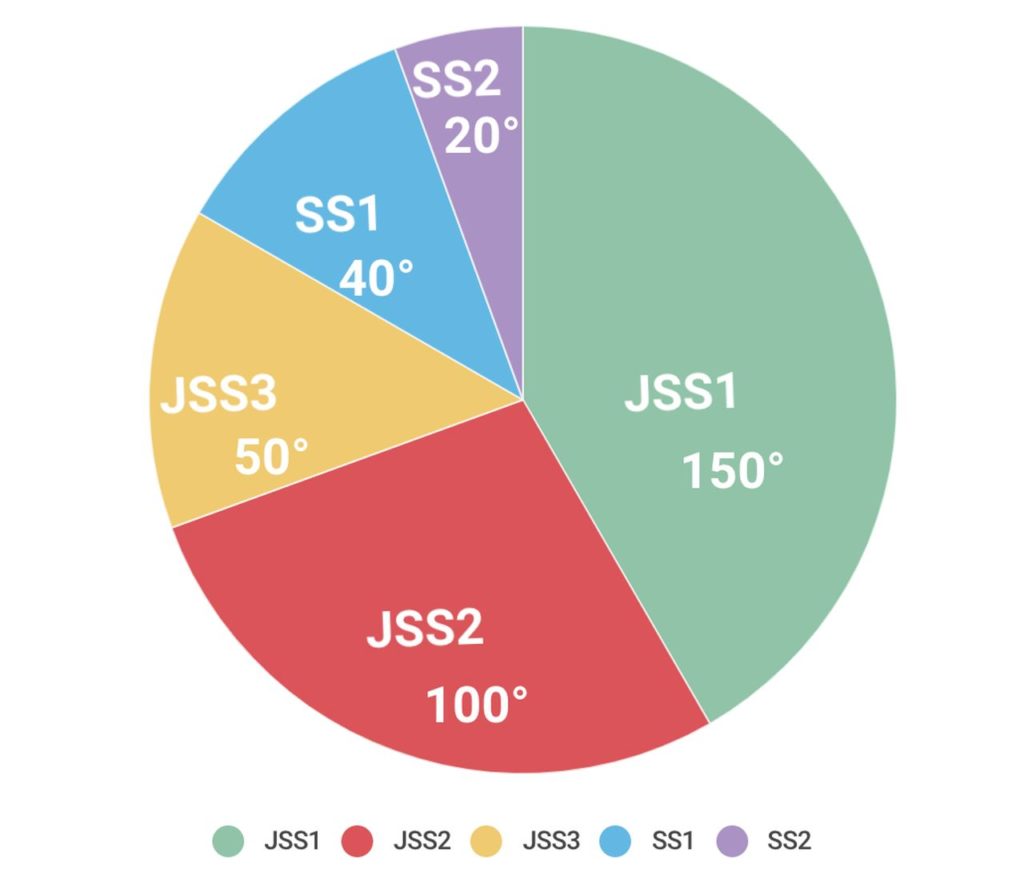
Example: The total population of students in Akudi Boys high school from JSS 1 – SS 2 is as follows.
| Class | Population of Students |
| JSS 1 | 300 |
| JSS 2 | 200 |
| JSS 3 | 100 |
| SS 1 | 80 |
| SS 2 | 40 |
| Total | 720 |
Present the above information in a pie chart
The total Population = 300 + 200 + 100 + 80 + 40 = 720
JSS1 = \( \frac{300}{720}\scriptsize \: \times \: 360^0 \\ = \scriptsize 150^0 \)
JSS2 = \( \frac{200}{720}\scriptsize \: \times \: 360^0 \\ = \scriptsize 100^0 \)
JSS3 = \( \frac{100}{720}\scriptsize \: \times \: 360^0 \\ = \scriptsize 50^0 \)
SS1 = \( \frac{80}{720}\scriptsize \: \times \: 360^0 \\ = \scriptsize 40^0 \)
SS2 = \( \frac{40}{720}\scriptsize \: \times \: 360^0 \\ = \scriptsize 20^0 \)

Note: (i) The total number of degrees of a circle is 360°
(ii) Find the appropriate angle which represents the total population of students in Akudi Boys high school from JSS 1 – SS 2.
⇒ 150° + 100° + 50° + 40° + 20° = 360°


Responses