Back to Course

SS1: ECONOMICS - 1ST TERM

0% Complete
0/0 Steps
  1. Introduction to Economics | Week 1
    3 Topics
    |
    1 Quiz
  2. Basic Concept of Economics | Week 2
    4 Topics
    |
    1 Quiz
  3. Basic Tools for Economic Analysis | Week 3
    8 Topics
    |
    1 Quiz
  4. Measure of Central Tendency | Week 4
    4 Topics
    |
    1 Quiz
  5. Theory of Demand & Supply I | Week 5
    5 Topics
    |
    1 Quiz
  6. Theory of Demand & Supply II | Week 6
    7 Topics
    |
    1 Quiz
  7. Theory of Production I | Week 7
    7 Topics
    |
    1 Quiz
  8. Theory of Production II | Week 8
    4 Topics
    |
    1 Quiz
  9. Basic Economic Problems of the Society | Week 9
    1 Topic
    |
    1 Quiz
  10. Economic System | Week 10
    4 Topics
    |
    1 Quiz
  • excellence
  • Follow

Lesson Progress
0% Complete

Topic Content:

  • Definition of Demand Curve
  • Example of Demand Curve
  • Calculating the Slope of a Demand Curve

What is a Demand Curve?

A demand curve is a graphic representation of the relationship between price and quantity. It indicates the different quantities of a commodity demanded at different prices. 
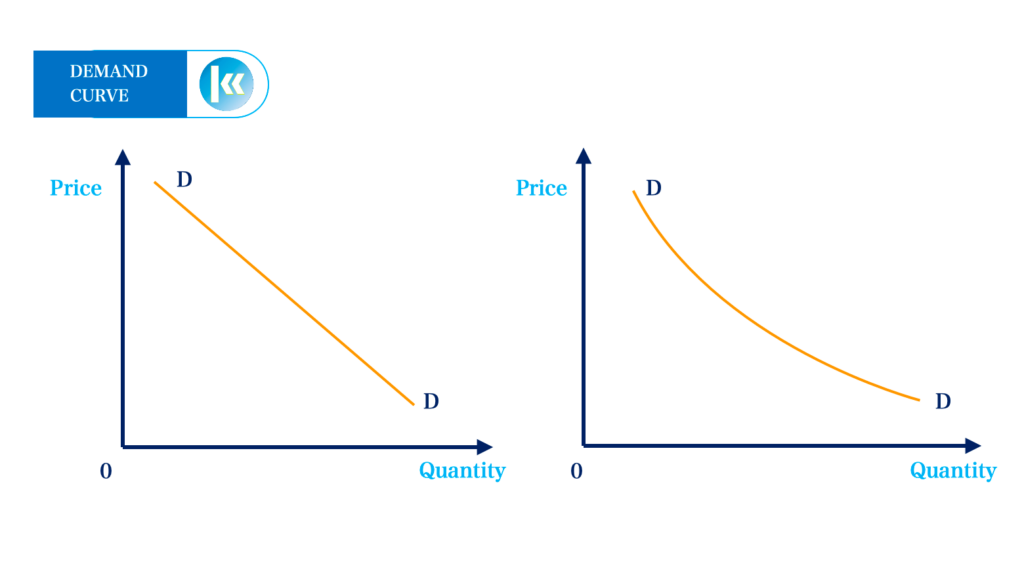
demand curve

The demand curve slopes downward from left to right, showing that more will be bought at lower prices than at higher prices. This means that quantity demand rises as price falls.

It also means that an increase in price causes a fall in quantity demanded, that is, quantity demanded rises as price falls. A normal demand curve is negatively sloped and concave to the point of origin.

The result of the inverse relationship between price and quantity demanded is the negative slope of the demand curve. It can also be said that the slope of the demand curve is downward which highlights the inverse relationship between price and quantity demanded.

Note: The demand curve is derived from a demand schedule, as discussed in the previous topic.

For example, the schedule below is based on a survey of college students who indicated how many bottles of Coke they would buy in a week, at various prices.

Price

Quantity
Demanded

800
70200
60400
50600
40800
301000
101400
01600

Quantity demanded tends to be lower at higher prices. This relationship is easiest to see when a graph is plotted, as shown below:

demand curve

Calculating Slope:

Since slope is defined as the change in the variable on the y-axis divided by the change in the variable on the x-axis, the slope of the demand curve equals the change in price divided by the change in quantity.

The slope formula = \( \frac{y_2\:-\: y_1}{x_2\:-\:x_1} \\ = \frac{P_2\:-\: P_1}{Q_2\:-\:Q_1} \)

To calculate the slope of a demand curve above, take two points on the curve. For example, use the two points labeled in the diagram above.

Between those points, the slope is: \( \frac{40\:-\:60}{800\:-\:400} \\ = \frac{-20}{400} \\ = \scriptsize -0.05 \)

Since this demand curve is a straight line, the slope of the curve is the same at all points.

Subscribe
Notify of
guest
0 Comments
Oldest
Newest
Inline Feedbacks
View all comments
0
Would love your thoughts, please comment.x
()
x