Topic Content:
- Distance-Time Graph of Motion
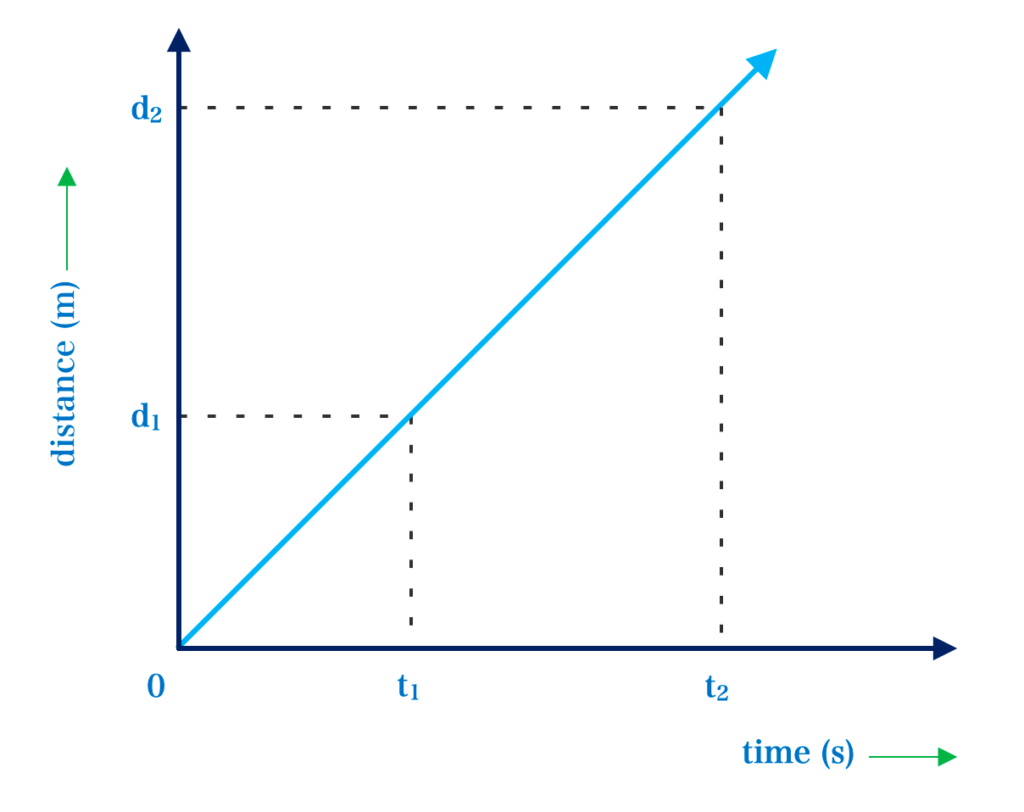
The distance – time graph of speed is obtained by plotting different values of distance on the vertical axis against different values of time on the horizontal axis. This is shown in the diagram below:

From the graph (Fig. 5.1.1 ), the slope of the graph is:
You are viewing an excerpt of this Topic. Subscribe Now to get Full Access to ALL this Subject's Topics and Quizzes for this Term!
Click on the button "Subscribe Now" below for Full Access!
Subscribe Now
Note: If you have Already Subscribed and you are seeing this message, it means you are logged out. Please Log In using the Login Button Below to Carry on Studying!


Responses