SS1: PHYSICS – 1ST TERM
-
Introduction to Physics | Week 14 Topics|1 Quiz
-
Measurement I | Week 23 Topics|1 Quiz
-
Measurement II | Week 36 Topics|1 Quiz
-
Motion | Week 45 Topics|1 Quiz
-
Velocity-Time Graph | Week 54 Topics|1 Quiz
-
Causes of Motion | Week 65 Topics|1 Quiz
-
Work, Energy & Power | Week 73 Topics
-
Energy Transformation / Power | Week 83 Topics|1 Quiz
-
Heat Energy | Week 95 Topics|1 Quiz
-
Linear Expansion | Week 107 Topics|1 Quiz
Velocity-Time Graph of Motion
Topic Content:
- Velocity-Time Graph of Motion
We obtain the Velocity-time graph by plotting values of velocities on the y-axis against different values of time (s) on the x-axis. This is shown in the figure below:
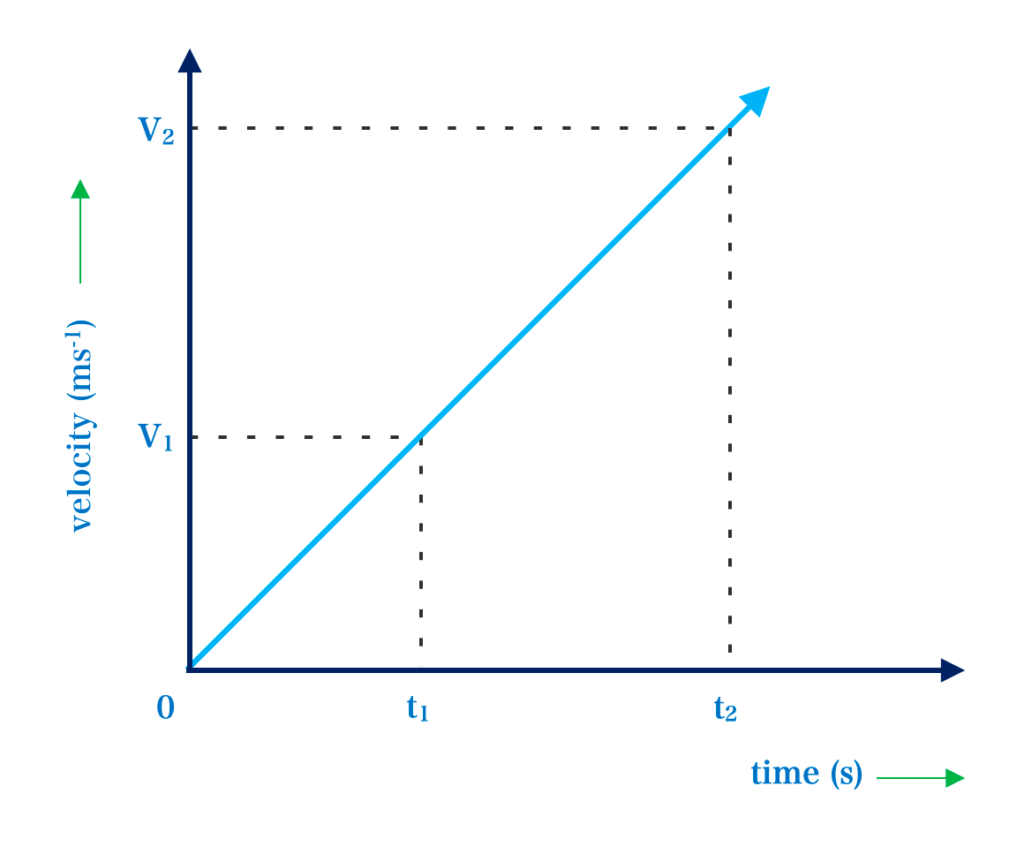
The slope, S, of the Vel-time graph (Fig 5.3.1) is:
S = \( \frac {Change \; in \; velocity}{Change \; in \; time} \)
S = \( \frac {V_2 \; – \; V_1}{t_2 \; – \; t_1} = \frac{ΔVel}{Δ time} \scriptsize \) = acceleration
The Slope of the graph represents the acceleration of the body.

The graph above (Fig 5.3.2) represents the uniform acceleration of a body.

The graph (Fig 5.3.3) represents the retardation or deceleration of a body.
The slope of Vel-time graph S is:
S = \( – \frac {Change \; in \; velocity}{Change \; in \; time} \)
S = \( -\frac{ΔVel}{Δ time} \scriptsize \) = retardation or deceleration
The slope of the graph represents the retardation of the body. It is negative because the graph descends from left to right.