Quiz 8 of 16

2018 Mathematics WAEC Theory Past Questions

Responses

Your email address will not be published. Required fields are marked *

Question 1

A used car was purchased at N900,000.00. Its value depreciated by 30% in the first year. In each subsequent year, the depreciation was 22% of its value at the beginning of that year. If the car was bought on 1st March, 2011, calculate correct to the nearest hundred naira, the value of the car on 28th February, 2015.

Solution

Step 1: Determine the value of the car at the end of the first year (i.e. Mar 2011- Feb 2012)

= \( \frac{70}{100} \scriptsize \: \times \: 900,000 \)

= N630,000

Step 2: Hence the value of the car at the next 4 years (i.e. Mar 2012 – Feb 2015)

Using Geometric sequence

⇒ i.e Tn = arn – 1

= \( \scriptsize 630,000 \: \times \: \left( \normalsize \frac{78}{100}\right) ^{4 \: – \: 1} \)

= \( \scriptsize 630,000 \: \times \: \left( \scriptsize  0.78\right) ^{3} \)

= \( \scriptsize 298,967.76\)

= N299,000 (to the nearest hundred naira)

Question 2a

The graph of y = 2px² – p²x -14  passes through the point (3, 10). Find the value of p.

Solution

Step 1: If the graph passes through the point (3,10), then we can substitute the given coordinates intoas follows:

10 = 2p(3)² – p²(3) – 14 

Step 2: We then solve for p.

10 = 18p – 3p² – 14

3p² – 18p + 24 = 0

p² – 6p + 8 = 0 

p² – 4p – 2p + 8 = 0

p(p – 4) – 2(p – 4) = 0

(p – 2)(p – 4) = 0 

p = 2 or 4

Question 2b

Two lines, 3y – 2x = 21 and  4y + 5x = 5 intersect at the point Q. Find the coordinate of Q.

Solution

Step 1: The coordinates of Q is obtained by solving the two equations simultaneously

3y – 2x = 21……………..(1)

4y + 5x = 5………………(2)

Step 2: Multiply equation (1) 4 and equation (2) by 3

3y – 2x = 21……………..(1) x 4

4y + 5x = 5………………(2) x 3

12y – 8x = 84……………(3)

12y + 15x = 15………….(4)

Step 3: Subtract equation 4 from equation 3

-23x = 69

x = \( \frac{-69}{23} \)

x = -3

Step 4: Substitute for x in equation (1)

3y – 2x = 21……………..(1)

3y – 2(-3) = 21

3y + 6 = 21

3y = 21 – 6

3y = 15

y = \( \frac{15}{3} \)

y = 5

Hence the coordinates of Q are (-3, 5)

Question 3

(a) The diagonals of a rhombus are 10.2cm and 9.3cm long. Calculate, correct to one decimal place, the perimeter of the rhombus

Solution

Step 1: The diagram can be sketched as shown below

Step 2: From ΔAEB

\( \scriptsize AB^2 = (4.65)^2 \: + \: (5.1)^2 \) \( \scriptsize AB^2 = 21.6225 \: + \: 26.01 \) \( \scriptsize AB^2 = 47.6325 \) \( \scriptsize AB = \sqrt{47.6325} \) \( \scriptsize AB = 6.901\)

Step 3: The perimeter of the rhombus is

4 x 6.901

= 27.606

≅ 27.6cm (to 1 decimal place)

Question 3b

Given that sin x = \( \frac{3}{5}, \scriptsize\: 0^o < x^o <90^o \)

Find the value of 5 cosx – 4 tan x

Solution

Step 1: Given that sin x = \( \frac{3}{5} \),  where 00 < x < 900 using right-angled triangle, we  have

By Pythagoras, \( \scriptsize y^2 = 5^2 – 3^2 \)

\( \scriptsize y^2 = 25 – 9 \)

\( \scriptsize y^2 = 16 \)

\( \scriptsize y = \sqrt{16} \)

\( \scriptsize y = 4 \)

Step 3: From the right- angled triangle, \( \scriptsize cos x = \normalsize \frac{4}{5} \scriptsize, \: and \: tanx = \normalsize \frac{3}{4} \)

Step 4: Hence, 5cosx – 4tanx =

\( \scriptsize 5 \left( \normalsize \frac{4}{5} \right) \scriptsize \: – \: 4 \left(\normalsize \frac{3}{4} \right) \)

= 4 – 3

= 1

Question 4a

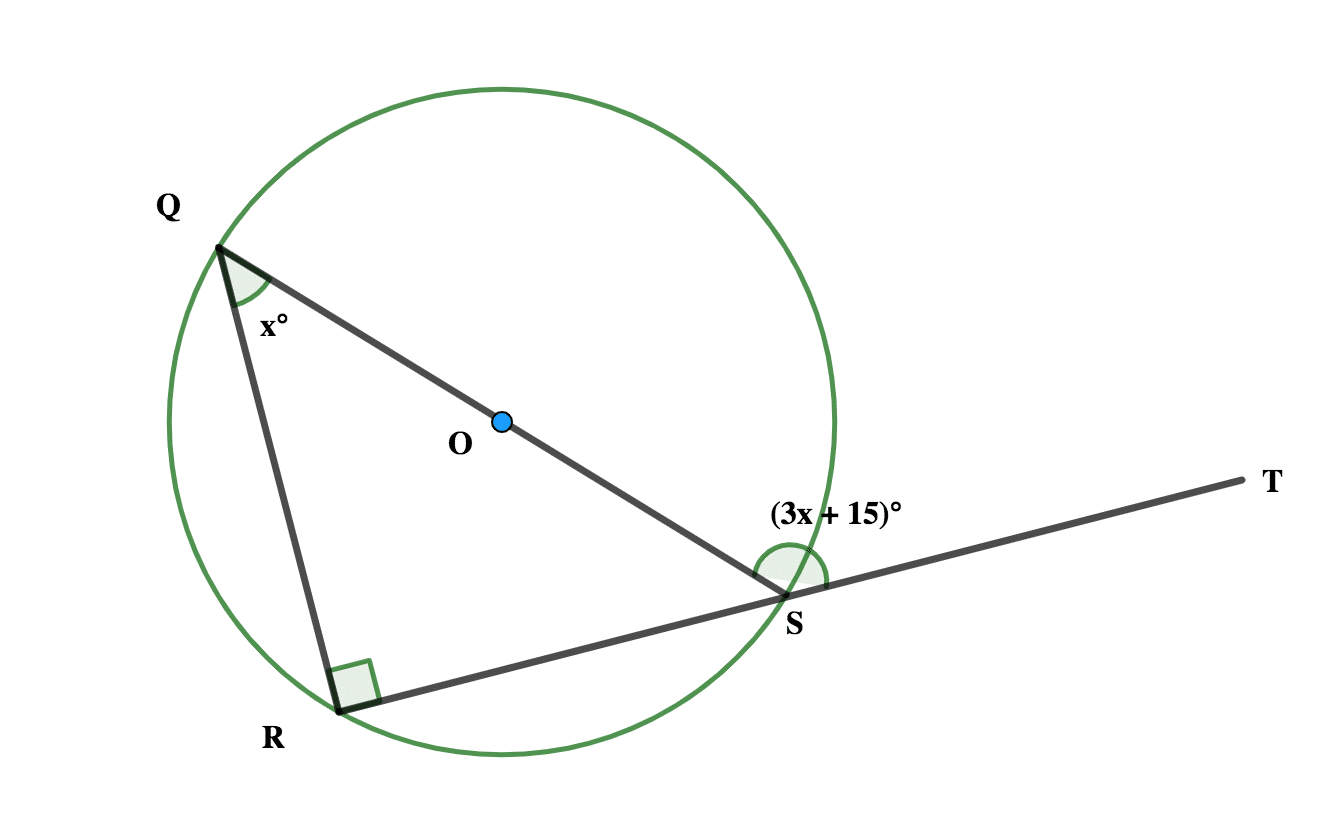
In the diagram < QOS is a diameter, <RQS = xº and <QST =  (3x + 15)º Find:

(i) The value of x

Solution

Step 1: from the diagram

\( \scriptsize \hat{QST} = \hat{SQR} \: + \: \hat{QRS} \)

[Exterior angle of a triangle…]

(3x + 15)º = xº + 90º

Step 2: Solving for x

⇒ 3x – x = 90 – 15

2x = 75

x = \( \frac{75}{2} \)

x = 37.5º


(ii) < RSQ

Solution

Step 1:

\( \scriptsize \hat{RSQ} = 180 \: – \: (3x + 15) \)

[angle on a straight line = 180)

\( \scriptsize \hat{RSQ} = 180 \: – \: 3x \: –  \: 15 \) \( \scriptsize \hat{RSQ} =  165 \: – \: 3x \)

Step 2:  Substitute x = 37.5º

⇒  \( \scriptsize \hat{RSQ} =  165 \: – \: 3x \)

\( \scriptsize \hat{RSQ} =  165 \: – \: 3(37.5) \) \( \scriptsize \hat{RSQ} =  165 \: – \: 112.5\) \( \scriptsize \hat{RSQ} =  52.5^o \)

Question 4b

If 2N4Seven= 15Nnine, find the value of N.

Solution

Step 1: Given that

2N4Seven= 15nine

Converting both sides to base ten

(2 x 72) + (N x 71) + (4 x 70) = (1 x 92) + (5 x 91) + (N x 90

98 + 7N + 4 = 81 + 45 + N

102 + 7N = 126 + N

Step 3: Collecting like terms

⇒ 7N – N = 126 – 102

6N = 24

N = \(  \frac{24}{6} \)

N = 4

Question 5a

If the mean of m, n, s, p and q is 12, calculate the mean of (m + 4), (n -3), (s + 6), (p -2) and (q + 8).

Solution

Step 1: Given that

= \( \frac{m \: + \: n \: + \: s \: + \: p \: + \: q}{5} \scriptsize = 12\)

then it implies that

m + n + s + p + q = 60 ……………(1)

Step 2: The mean of (m + 4), (n – 3), (s + 6), (p – 2) and (q + 8) is

= \( \frac{m + 4 \: + \: n – 3 \: + \: s + 6 \: + \: p – 2 \: + \: q + 8}{5} \)

Step 3: This can be simplified as

\( \frac{m \: + \: n \: + \: s \: + \: p \: + \: q \: + \: 13}{5} \) ………….(2)

Step 4: Substituting equation (1) in (2)

\( \frac{60 \: + \: 13}{5} \)

=\( \frac{73}{5} \)

= 14.6

Question 5b

(b) In a community of 500 people the 75th percentile age is 65years while the 25th percentile age is 15years. How many of the people are between 15 and 65years?

Solution

Step 1: The 75th percentile

= \( \left (\frac{75}{100} \: \times \: \frac{500}{1}  \right)^{th} \scriptsize =  \left(75 \: \times \: 5  \right )^{th} \\ \scriptsize = 375^{th} \: observation \)

Step 2: Hence 375 people are at most 65years old.

Step 3: The 25th percentile is

= \( \left (\frac{25}{100} \: \times \: \frac{500}{1}  \right)^{th} \scriptsize =  125^{th} \: observation \)

Step 4: Hence 125 people are at most 15years.

Step 5: Hence the number of people between 15 and 65 years of age is

375 – 125

= 250

Question 6

In a roadworthiness test on 240 cars, 60% passed. The number that failed had faults in Clutch, Brakes, and Steering as follows: Clutch only – 28; Clutch and Steering – 14; Clutch, Steering and brakes – 8; Clutch and Brakes – 20; Brakes and Steering only – 6. The number of cars with faults in Steering only is twice the number of cars with faults in Brakes only.

(a) Draw a Venn diagram to illustrate this information

(b) How many cars had;

(i) Faulty Brakes

(ii) Only one faulty?

Solution

Step 1: Let the items be represented as follows:

Clutch – C

Brakes – B

Steering – S

Step 2: Using set notations

\( \scriptsize \cap(C/(B \cup S) = 28 \) \( \scriptsize \cap(C\cap S) = 14 \) \( \scriptsize \cap(C\cap S\cap B) = 8 \) \( \scriptsize \cap(C\cap B) = 20\) \( \scriptsize \cap(B\cap S/C) = 6\) \( \scriptsize \cap(S/B\cup C) = 2x\) \( \scriptsize \cap(B/S\cup C) = x\)

60% of 240 =

\( \frac{60}{100} \: \times \: \frac{200}{1} \)

= 144

(a) Step 3: The Venn diagram illustrating the information is

(b) Step 1: From the Venn diagram above,

240 – 144 = 2x + 6 + 8 + 6 + x + 12 + 28

96 = 3x – 60

96 – 60 = 3x

3x = \( \frac{36}{3} \)

x = 12

Step 2: Hence the number of cars with faulty Brakes is =

6 + 8 + 12 + 12 = 38

b(ii) Those with only one fault

= x + 2x + 28

= 12 + 2(12) + 28

= 12 + 24 + 28

= 36 +  28

= 64

Question 7a

(a) Find the equation of the line passing through the points (2, 5) and (-4, -7).

Solution

Step 1: The equation of the line passing through points

(x1, y1) and (x2, y2) is given as

\( \frac{y \: – \: y_1}{x \: – \: x_1} = \frac{y_2 \: – \: y_1}{x_2 \: – \: x_1} \)

Step 2: Substituting the given coordinates

\( \frac{y \: – \: 5}{x \: – \: 2} = \frac{-7 \: – \: 5}{-4\: – \: 2} \)

Step 3: Simplifying this we have

\( \frac{y \: – \: 5}{x \: – \: 2} = \frac{-12}{-6} \) \( \frac{y \: – \: 5}{x \: – \: 2} \scriptsize = 2\) \( \scriptsize  y \: – \: 5 = 2(x \: – \: 2)\) \( \scriptsize  y \: – \: 5 = 2x \: – \: 4\) \( \scriptsize  y \: – \: 2x \: – \: 1 = 0\)

Question 7b

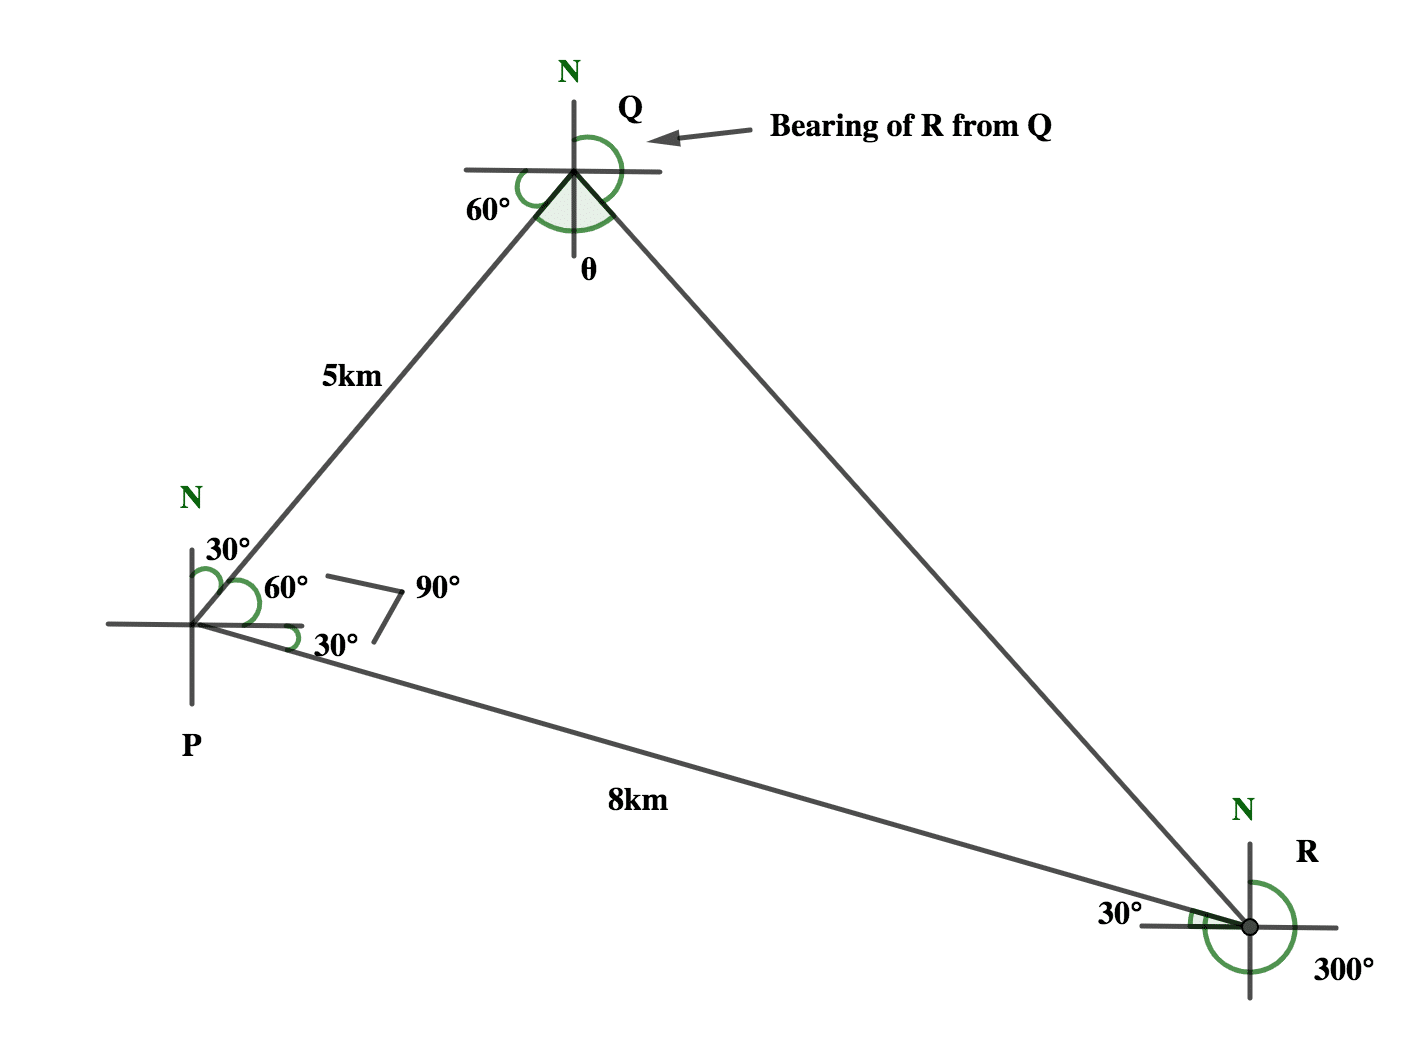
(b) Three ships P, Q, and R are at sea. The bearing of Q from P is 0300 and the bearing of P from R is 3000. If |PQ|= 5km and |PR|= 8km,

(i) Illustrate the information in a diagram


(ii) Calculate, correct to three significant figures, the:

distance between Q and R;

Solution

Step 1: Since the ΔQPR is a right-angled triangle, then by Pythagoras

QR2 = QP2 + PR2

QR2 = 52 + 82

QR2 = 25 + 64

QR2 = 89

QR = √89

QR= 9.433

QR ≅ 9.433 km (to 3 significant figures)


bearing of R from Q

To calculate the bearing of R from Q

Step 1: From triangle QPR, let \( \scriptsize \hat{PQR} = \theta \)

Step 2: Sinθ = \( \frac{8}{9.43} \)

Sinθ = 0.8483

θ = Sin-1 (0.8483)

θ  = 580

Step 3: Hence the bearing of R from Q is 2700 – (60 + 58)0

= 270 -118

= 1520

Question 8a

(a) Lamin bought a book for N300.00 and sold it to Bola at a profit of x% Bola then sold the same book to James at a profit of  x%. If James paid \( \scriptsize N \left(  6x \: + \: \normalsize \frac{3}{4}\right) \) more for the book than what Lamin paid, find the value of x.

Solution

Step 1: Bola bought the book for

(100 + x)%  of N300

= \( \frac{100 \: + \: x}{100} \: \times \: \frac{300}{1} \)

= N(300 + 3x)

Step 2: James bought the book from Bola for

(100 + x)%  of N (300 + 3x)

⇒ \( \frac{100 \: + \: x}{100} \: \times \: \scriptsize (300 \: + \: 3x) \)

⇒ \(\left[  \frac{(100 \: + \: x)(300 \: + \: 3x)}{100} \right ]     \)

Step 3: If James paid \( \scriptsize N \left(  6x \: + \: \normalsize \frac{3}{4}\right) \) more for the book than what Lamin paid, then

⇒ \( \frac{(100 \: + \: x)(300 \: + \: 3x)}{100} \scriptsize \: – \: 300 = \left( \scriptsize 6x \: + \: \normalsize \frac{3}{4}\right)   \)

\( \frac{3(100+x)(100+x)}{100} \scriptsize\: – \: 300 = \normalsize \frac{24x \: + \: 3}{4} \) \( \frac{3(100+x)^2}{100} \scriptsize\: – \: 300 =  \normalsize  \frac{3(8x \: + \: 1)}{4} \)

Step 4: Divide through by 3

\( \frac{(100+x)^2}{100} \scriptsize\: – \: 100 = \normalsize  \frac{8x \: + \: 1}{4} \)

Step 5: Multiplying through by 100

\( \scriptsize (100 \: + \: x)^2 \: – \: 10,000 = 25(8x \: + \: 1) \)

Step 6: Expanding and solve for x

\( \scriptsize (10000 \: + \: 200x \: + \: x^2) \: – \: 10,000 = 200x \: + \: 25 \) \( \scriptsize 10000\: – \: 10,000  \: + \: 200x \: + \: x^2  = 200x \: + \: 25 \) \( \scriptsize 200x \: – \: 200x \: + \: x^2  =   25 \) \( \scriptsize x^2  =   25 \) \( \scriptsize x  =   \sqrt{25} \)

x = 5

Question 8b

Find the range of values of   which satisfies the inequality 

\( \scriptsize 3x \: – \: 2  \: <  \: 10 \: + \: x  \: <  \: 2 \: + \: 5x \)

Solution

Step 1: Given that

\( \scriptsize 3x \: – \: 2  \: <  \: 10 \: + \: x  \: <  \: 2 \: + \: 5x \)

⇒ \( \scriptsize 3x \: – \: 2  \: <  \: 10 \: + \: x \)

\( \scriptsize 3x \: – \: x  \: <  \: 10 \: + \: 2 \) \( \scriptsize 2x  \: <  \: 12 \) \( \scriptsize x  \: <  \: \normalsize \frac{12}{2} \) \( \scriptsize x  \: <  \: 6 \)

Step 2: We also have that

\(  \scriptsize 10 \: + \: x  \: <  \: 2 \: + \: 5x \) \(\scriptsize   x \: – \: 5x  \: <  \: 2 \: – \: 10 \) \( \scriptsize  -4x  \: <  \: -8 \) \( \scriptsize x  \: >  \: \normalsize \frac{-8}{-4} \) \( \scriptsize x  \: >  \: 2 \)

Step 3: Hence the range of x values that satisfy the inequality is

\( \scriptsize ( x< 6) \cup (x > 2) \)

⇒ \( \scriptsize ( 2 < x < 6) \)

Question 9

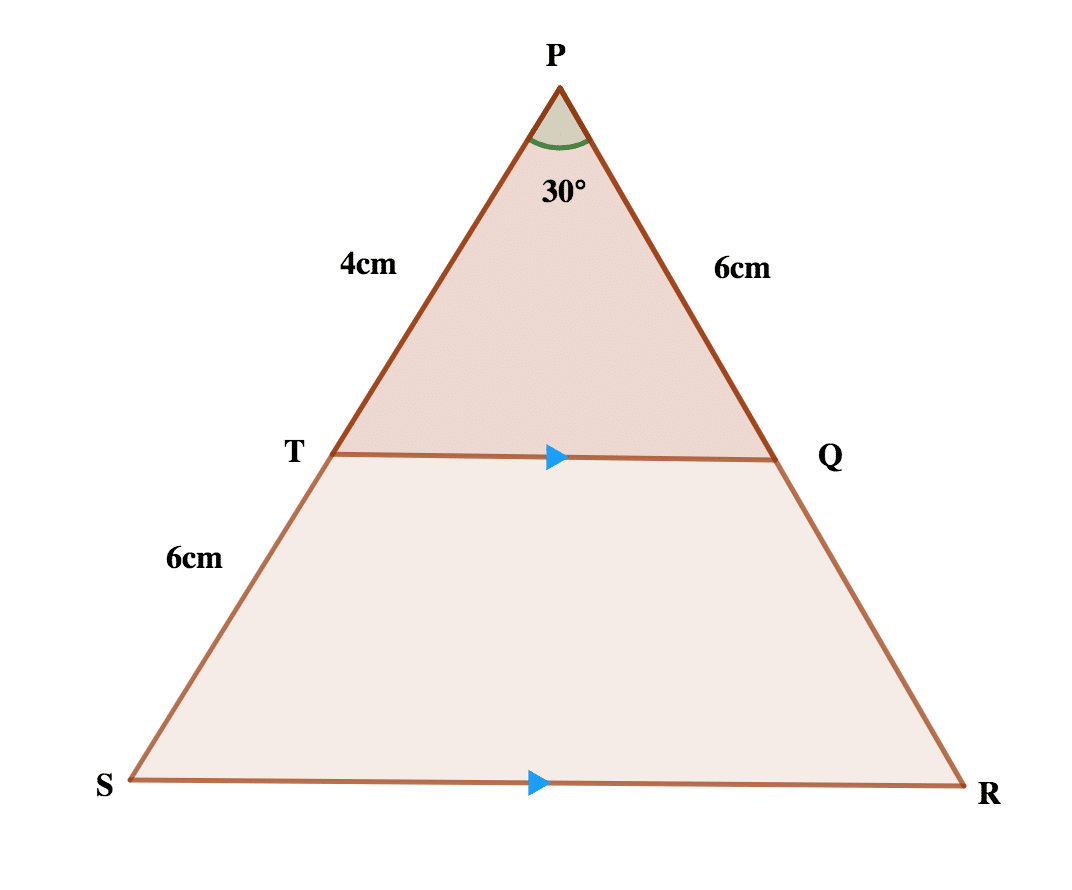
In the diagram, |PT|= 4cm, |TS| = 6cm, |PQ|= 6cm and <SPR= 300. Calculate, correct to the nearest whole number.

(a) |SR|

Solution

Step 1: Extract out the two similar triangles in the figure, as shown below.

Step 2: From the two similar triangles:-

\( \frac{|SR|}{|SP|} = \frac{|TQ|}{|TP|} \) …………(i)

Step 3: From ΔPTQ; by Cosine rule ….if p = |TQ|

\( \scriptsize p^2 = t^2 \: + \: q^2 \: – \: 2tqCosp \) \( \scriptsize p^2 = 6^2 \: + \: 4^2 \: – \: (2 \: \times \: 6 \: \times \: 4 \: \times \: cos30^o) \) \( \scriptsize p^2 = 36\: + \: 16 \: – \: 41.5692 \) \( \scriptsize p^2 = 52 \: – \: 41.5692 \) \( \scriptsize p^2 = 10.4308\) \( \scriptsize p = \sqrt{10.4308}\)

p = 3.22cm

|TQ| = 3.22cm

Step 4: Substituting = |TQ| =3.22 in equation (i)

\( \frac{|SR|}{|SP|} = \frac{|TQ|}{|TP|} \) …………(i)

\( \frac{|SR|}{|10|} = \frac{3.22}{4}  \)

4 x |SR| = 3.22 x 10

|SR| = \( \frac{32.2}{4} \)

|SR| = 8.05

|SR| ≅ 8cm (to the nearest whole number)


(b) area of TQRS.

Solution

To calculate the area of TQRS.

Step 1: Area of TQRS = Area of  ΔPSR – Area of ΔPTQ

Step 2: Area of ΔPTQ =

\( \frac{1}{2} \scriptsize \: \times \: 4 \: \times \: 6 \: \times \: sin30^o \) \( \frac{1}{2} \scriptsize \: \times \: 4 \: \times \: 6 \: \times \: \normalsize \frac{1}{2}\)

= 3 x 2

= 6cm²

Step 3: Determine |PR| In  ΔPSR

\( \frac{|TP|}{|PQ|} = \frac{|SP|}{|PR|} \) \( \frac{4}{6} = \frac{10}{|PR|} \)

|PR| = \( \frac{6 \: \times \:  10}{4} = \frac{60}{4} \)

|PR| = 15cm

Step 4: Area of  ΔPSR

= \( \frac{1}{2} \scriptsize \: \times \: 10 \: \times \: 15 \: \times \: sin30^o\)

= 5 x 15 x 0.5

=37.5cm²

Step 5: Therefore the area of

TQRS = (37.5 – 6)cm²

= 31.5cm²

≅ 32cm² (to the nearest whole number).

Question 10a

In  ΔPQS, |PQ|=12cm, |PS|= 5cm, <SPQ = <PQR = 900, Find, correct to the three significant figures, |PR|.
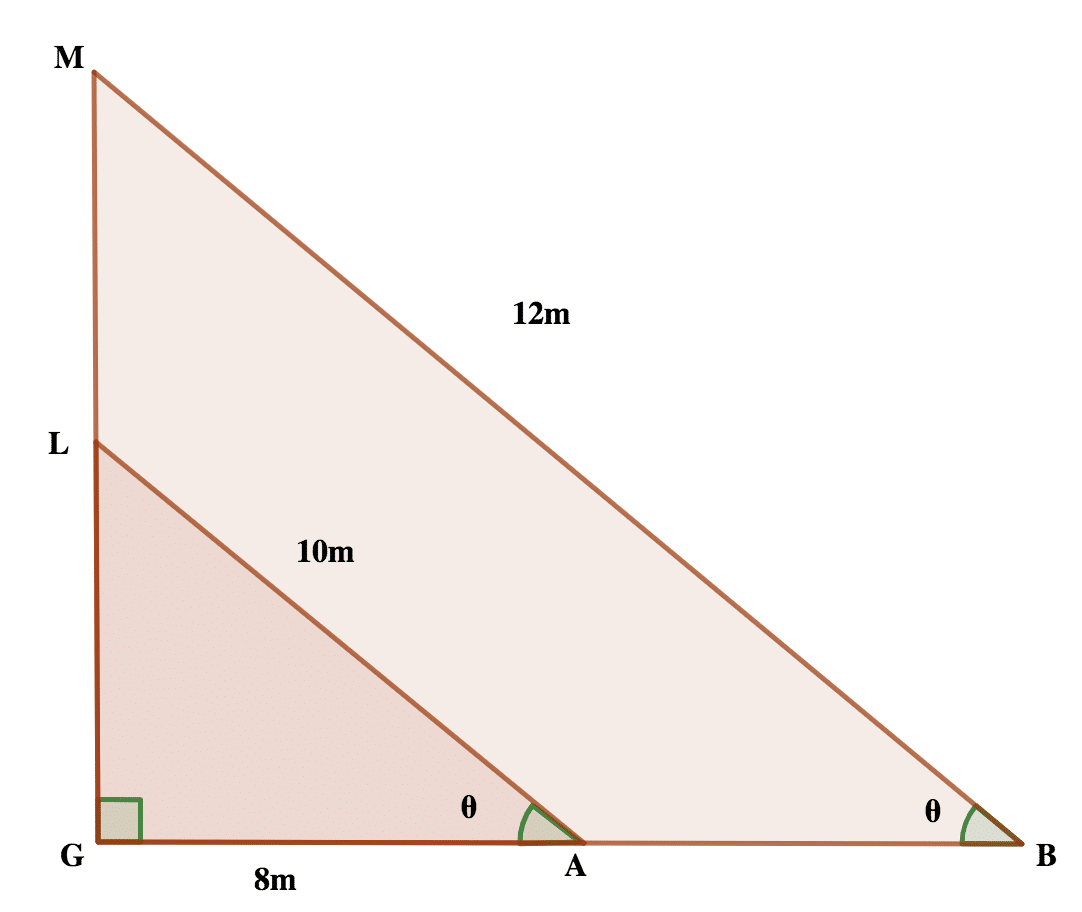
Solution

Step 1: From  ΔPQS

Let \( \scriptsize \hat{PSR} = \theta \)

Tanθ = \( \frac{12}{5} \)

Tanθ = 2.4

θ = Tan-1(2.4)

θ = 67.38º

Step 2: From  ΔPRS

Sin67.38º = \( \frac{PR}{5} \)

PR = 5 x sin 67.38

PR = 4.615

PR ≅ 4.62cm (to 3 significant figures)

Question 10b

The lengths of two ladders, L and M are 10m and 12m respectively. They are placed against a wall such that each ladder makes the same angle with the horizontal ground. If the foot of L is 8cm from the foot of the wall.

(i) Draw a diagram to illustrate this information

Solution

Step 1: The information can be illustrated with the diagram below.


(ii) Calculate the height at which M touches the wall

Step 2: To calculate the height of M, i.e. |MG|

From ΔLGA

Cosθ = \( \frac{8}{10} \)

Cosθ = 0.8

θ = Cos-1(0.8)

θ = 36.86º

Step 3: From  ΔMGB

Sinθ = \( \frac{MG}{12} \)

|MG| = 12 x sin36.86

|MG| = 7.198

|MG|≅ 7.20m

Question 11

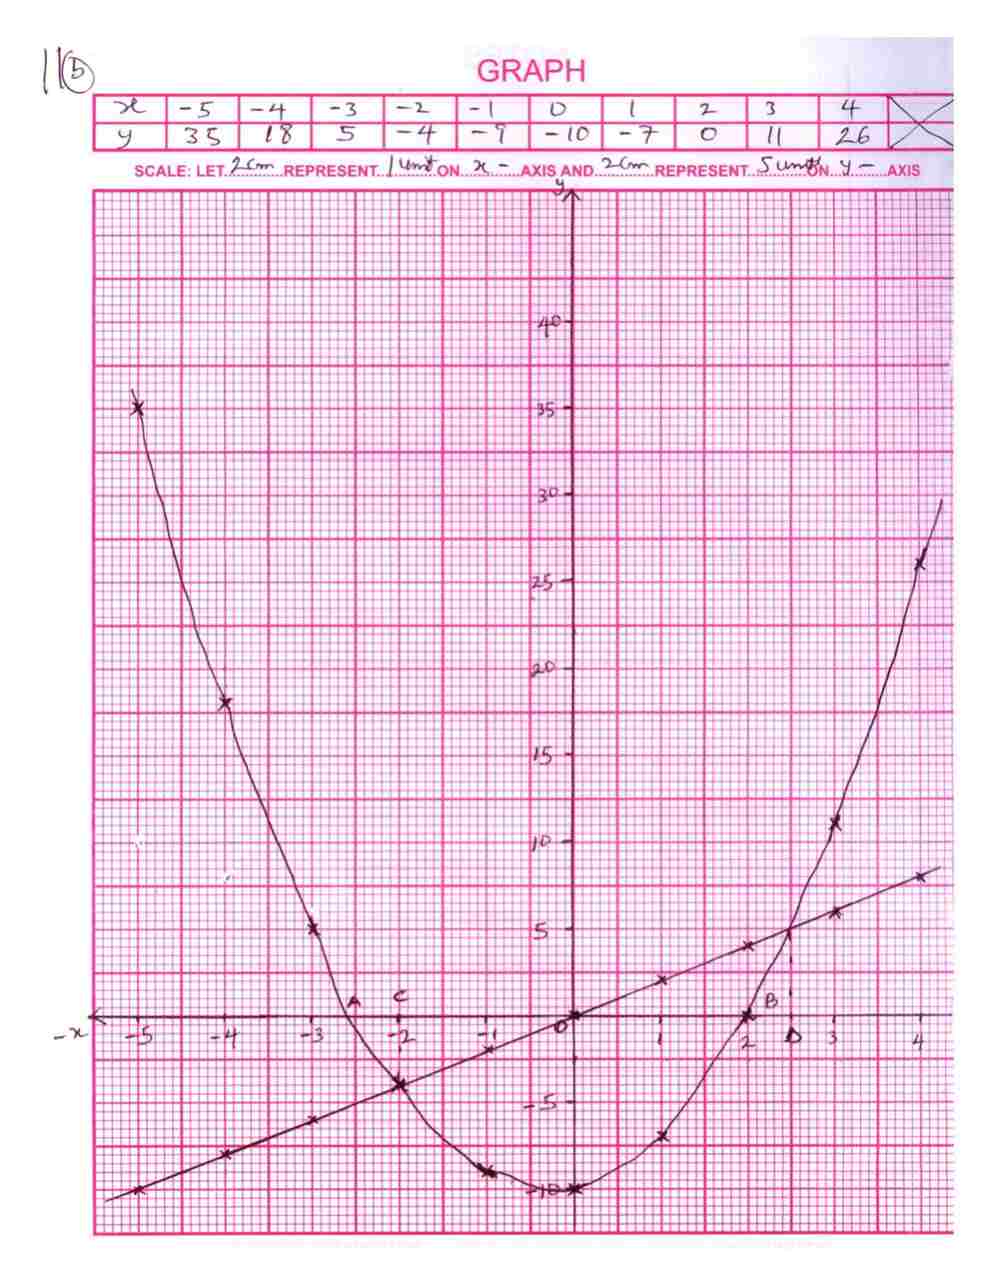
(a) Copy and complete the table of values for

y = 2x² + x – 10 for -5 ≤ x ≤ 4

x

-5

-4

-3

-2

-1

0

1

2

3

4

y    

5


-9

-10


0


Solution

Step 1: The table can be copied and completed as follows:

x

-5

-4

-3

-2

-1

0

1

2

3

4

2x²

50

32

18

8

2

0

2

8

18

32

x

-5

-4

-3

-2

-1

0

1

2

3

4

-10

-10

-10

-10

-10

-10

-10

-10

-10

-10

-10

y

35

18

5

-4

-9

-10

-7

0

11

26


(b)Using scales of 2cm to 1 unit on the x-axis and 2cm to 5 units on the y-axis draw the graph of  y = 2x² + x – 10 for -5 ≤ x ≤ 4


(c) Use the graph to find the solution of:

(i) 2x² + x = 10

Solution

Step 1: The solution of the equation 2x² + x = 10

2x² + x – 10 = 0

When compound with the graph y = 2x² + x – 10

⇒ y = 0

Step 2: Hence the solution to the equation is the points where the graph cut the x-axis or line y = o  i.e. the points are labelled A and B on the graph.

⇒ x = -2.55 or 2.0

(ii) 2x² + x – 10 = 2x

Solution

Step 3:

(ii) The solution of 2x² + x – 10 = 2x  is obtained by comparing 2x² + x – 10 = 2x with the graph

y = 2x² + x – 10

⇒ y = 2x

Step 4: We will now prepare a table of values for  y = 2x

x

-5

-4

-3

-2

-1

0

1

2

3

4

y= 2x

-10

-8

-6

-4

-2

0

2

4

6

8

Step 5: We then sketch the group y = 2x on the same Cartesian coordinates as the previous graph.

Step 6: The solution of 2x² + x – 10 = 2x  is the points of intersection of the two graphs. The points are labelled C and D

From the graph, the solution is x = -2 or 2.5

Question 12a

If

x = \(\scriptsize \binom{2}{3}\)

y = \( \scriptsize \binom{5}{-2}\)

z = \( \scriptsize \binom{-4}{13}\)

Find Scalars p and q Such that px + qy = z  

Solution

Step 1: Given that  px + qy = z  Substituting p, q and z we have

\( \scriptsize p \binom{2}{3} \:  + \: q\binom{5}{-2} = \binom{-4}{13} \) \( \binom{2p \: + \: 5q}{3p \: – \:5q} = \binom{-4}{13} \)

Step 2: from above we can form the following equations

2p + 5q = -4 …………. (1)

3p – 2q = 13 ……………(2)

Step 3: Multiplying equation (1) by 3 and equation (2) by 3

2p + 5q = -4 …………. (1) x 3

3p – 2q = 13 ……………(2) x 2

6p + 15q = -12 …………. (3)

6p – 4q = 26 ……………(4)

Step 4: Subtract equation 4 from equation 3

19q = -38

q = \( \frac{-38}{19} \)

q = -2

Substitute q = -2  in equation (1)

2p + 5q = -4 …………. (1)

2p + 5(-2) = -4

2p  -10 = -4

2p = -4 + 10

2p = 6

p = \( \frac{6}{2} \)

p = 3

∴ p = 3 and q = -2

Question 12b

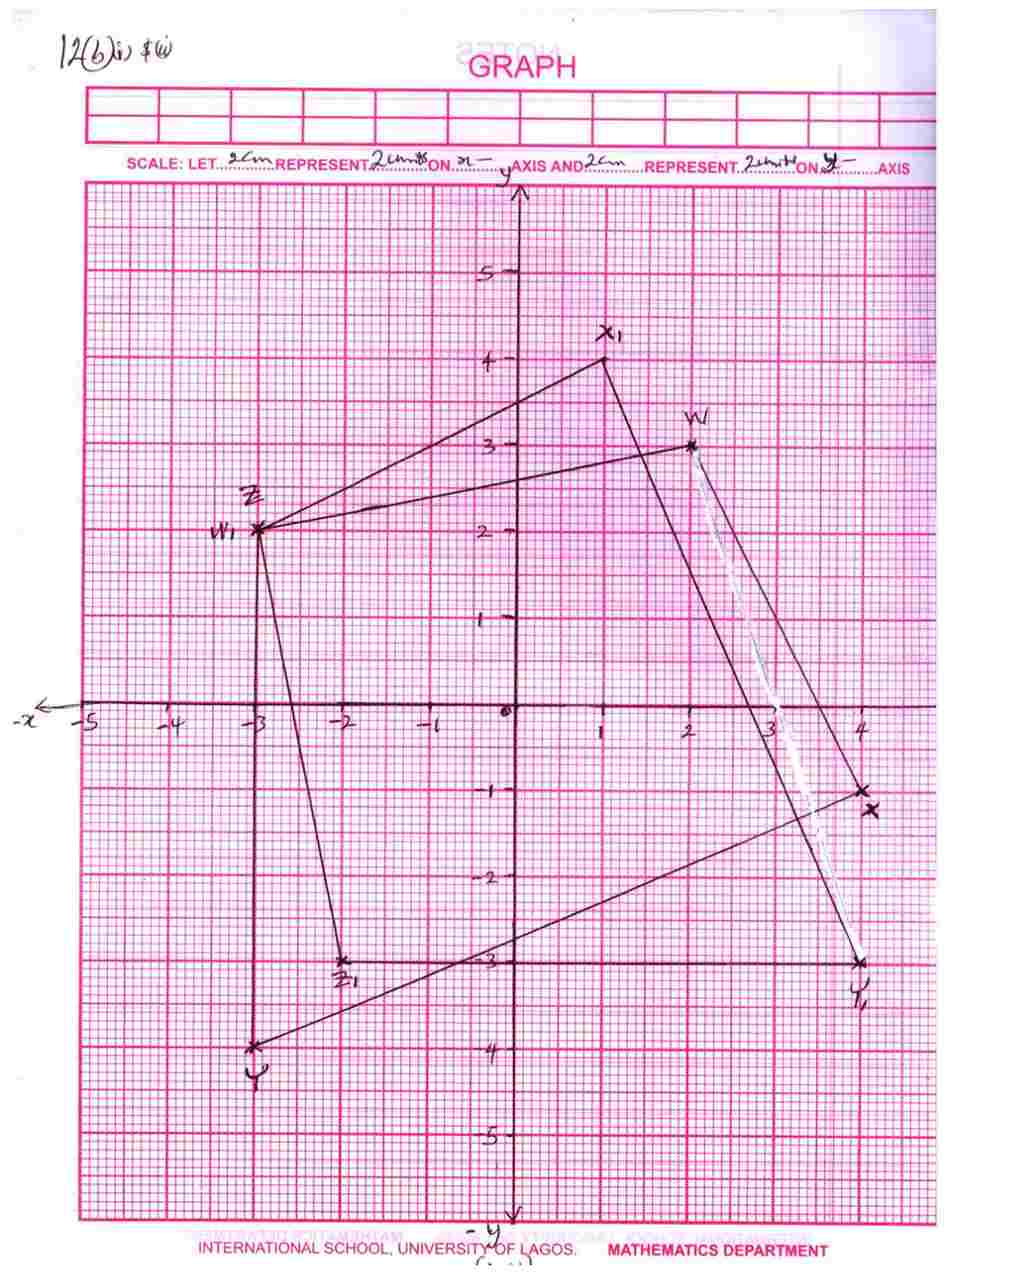
(b) (i) Using a scale of 2cm to 2 units on both axis, draw on a graph paper two perpendicular axis 0x and 0y for -5 ≤ x ≤ 5,  – 5  ≤ y ≤ 5 respectively

(ii) Draw on the graph paper, indicating clearly the vertices and their coordinates

(1) The quadrilateral WXYZ  with W(2,3), X(4, -1), Y(-3, -4)  and  Z(-3, 2)

(2) The image W1 X1 Y1 Z1 of quadrilateral WXYZ under an anti-clockwise rotation of 900 about the origin. Where W → W1, X → X1 , Y → Y1 and, Z → Z1

Solution

 See the graph for the image of quadrilateral WXYZ under an anticlockwise rotation of 900, i.e. W1 (-3, 2), X1(1,4), Y1(4, -3) and Z1 (-2, -3)

Question 13

Marks

10

20

30

40

50

60

70

80

90

Frequency

1

1

x

5

y

1

4

3

1

The frequency table shows the marks distribution of a class of 30 students in an examination. The mean mark of the distribution is 52.

(a) Find the values of x and y

Solution

Step 1: From the table

1 + 1 + x + 5 + y + 1 + 4 + 3 + 1 = 30

x + y + 16 = 30

x + y = 30 – 16

x + y = 14…………..(1)

Step 2: Also from the table we have that

Step 3: Simplifying this we have;

\( \frac{900 \: + \: 30x \: + \: 50y}{30}  \scriptsize = 52\)

900 + 30x + 50y = 1,560

30x + 50y = 1560 – 900

30x + 50y = 660

3x + 5y = 66 ……………..(2)

Step 4: From equation (1)

y = (14 – x)……….(*)

Substitute for y in equation (2)

⇒ 3x + 5(14 – x) = 66

3x + 70 – 5x = 66

-2x = 66 – 70

-2x = -4

x = \( \frac{-4}{-2} \)

x = 2

Step 5: From equation (*)

y = 14 – 2 = 12

∴x = 2 and y = 12


(b) Construct a group frequency distribution table starting with a lower class limit of 1 and a class interval of 10.

Solution

Step 1: The group frequency distribution table can be constructed as shown below

Class Interval

Class Boundaries

Frequency

1 -10

0.5 -10.5

1

11-20

10.5 – 20.5

1

21-30

20.5 – 30.5

2

31-40

30.5 – 40.5

5

41-50

40.5 – 50.5

12

51-60

50.5 – 60.5

1

61-70

60.5 – 70.5

4

71-80

70.5 – 80.5

3

81-90

80.5 – 90.5

1


(c) Draw a histogram for the distribution

Solution


(d) Use the histogram to estimate the mode.

Solution

Step 1: We join the right-hand corner of the highest bar in the histogram to the left top corner of the bar on its left

Step 2: We also join the left-hand corner of the highest bar in the histogram to the right top corner of the bar on its right

Step 3: We then trace the point of intersection of the two lines to the x-axis and determine the mode.

From the model is the point labelled M

i.e. Mode = 44

error: Alert: Content selection is disabled!!