


Quiz Summary
0 of 10 Questions completed
Questions:
Information
You have already completed the quiz before. Hence you can not start it again.
Quiz is loading…
You must sign in or sign up to start the quiz.
You must first complete the following:
Results
Results
0 of 10 Questions answered correctly
Your time:
Time has elapsed
You have reached 0 of 0 point(s), (0)
Earned Point(s): 0 of 0, (0)
0 Essay(s) Pending (Possible Point(s): 0)
Categories
- Not categorized 0%
- 1
- 2
- 3
- 4
- 5
- 6
- 7
- 8
- 9
- 10
- Current
- Review
- Answered
- Correct
- Incorrect
-
Question 1 of 10
1. Question
In a class of 20 students the scores in a mathematical test out of 10 marks are as follows:
5, 3, 6, 7, 8, 4, 5, 4, 9, 3, 4, 6, 4, 5, 7, 4, 5, 6, 7, 2
Use this information to answer question 1 – 3
The range of the distribution is
CorrectIncorrect -
Question 2 of 10
2. Question
In a class of 20 students the scores in a mathematical test out of 10 marks are as follows:
5, 3, 6, 7, 8, 4, 5, 4, 9, 3, 4, 6, 4, 5, 7, 4, 5, 6, 7, 2
Use this information to answer the question below
The mode of the scores is
CorrectIncorrect -
Question 3 of 10
3. Question
In a class of 20 students the scores in a mathematical test out of 10 marks are as follows:
5, 3, 6, 7, 8, 4, 5, 4, 9, 3, 4, 6, 4, 5, 7, 4, 5, 6, 7, 2
Use this information to answer the question below
The median score is
CorrectIncorrect -
Question 4 of 10
4. Question
Find the standard deviation of the following data – 5, – 4, – 3, -2, – 1, 0, 1, 2, 3, 4, 5
CorrectIncorrect -
Question 5 of 10
5. Question
Find the difference between the range and the variance of the following set of numbers 4, 9, 6, 3, 2, 8, 10, 5, 6, 7 where Σd2 = 60
CorrectIncorrect -
Question 6 of 10
6. Question
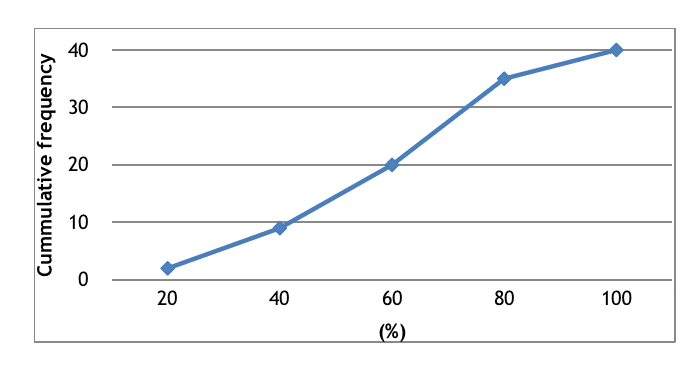
The diagram above shows the ogive for the scores obtained by 40 students in a mathematics test. Use the figure to answer the question below
The median score is
CorrectIncorrect -
Question 7 of 10
7. Question
The diagram above shows the ogive for the scores obtained by 40 students in a mathematics test. Use the figure to answer the question below
The upper quartile is
CorrectIncorrect -
Question 8 of 10
8. Question
The diagram above shows the ogive for the scores obtained by 40 students in a mathematics test. Use the figure to answer the question below
The interquartile range is
CorrectIncorrect -
Question 9 of 10
9. Question
The diagram above shows the ogive for the scores obtained by 40 students in a mathematics test. Use the figure to answer the question below
The percentile corresponding to a score of 80% is
CorrectIncorrect -
Question 10 of 10
10. Question
The following are measures of central tendency except
CorrectIncorrect