Topic Content:
- Compound Bar Charts
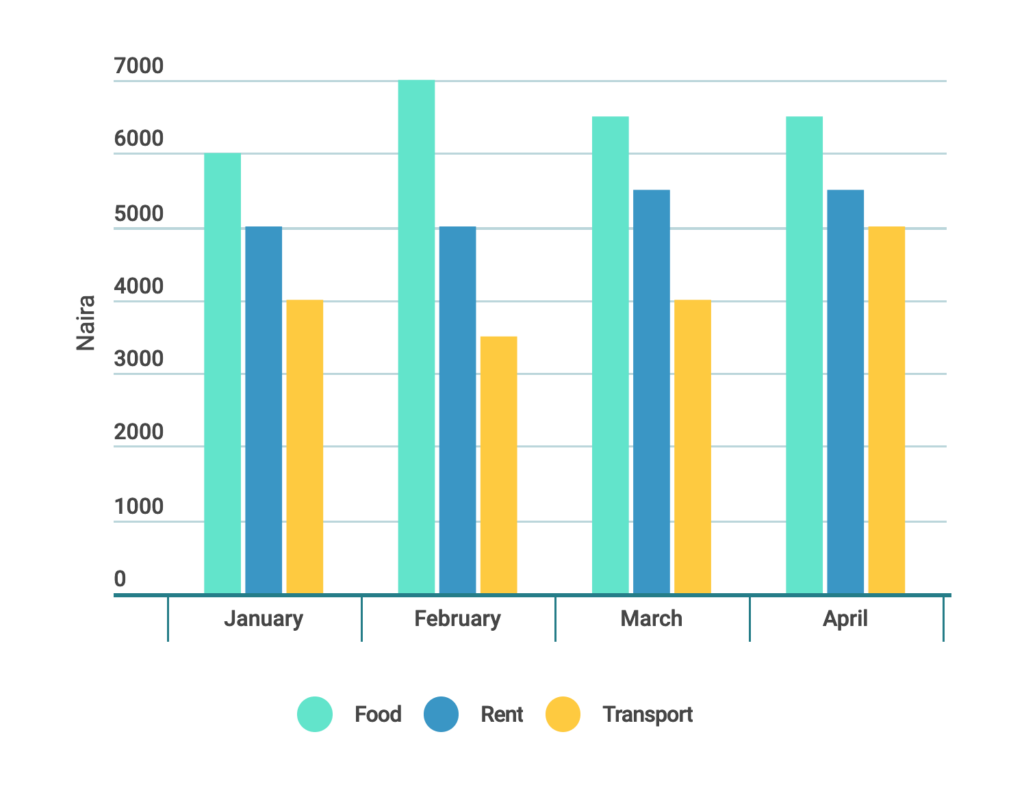
A compound bar chart is used to compare two or more different sets of information, arranged adjacent to one another.
Example 9.5.1:
The table below show that amount of money spent in naira by a family from January to April.
Illustrate the information in a compound bar chart
| Months | Food | Rent | Transport |
| January | 6000 | 5000 | 4000 |
| February | 7000 | 5000 | 3500 |
| March | 6500 | 5500 | 4000 |
| April | 6500 | 5500 | 5000 |
Solution

It is also used to compare two or more different sets of information with individual items divided into its component parts.
Example 9.5.2:
Illustrate the information in Example 9.5.1 as a component bar chart.
Solution
You are viewing an excerpt of this Topic. Subscribe Now to get Full Access to ALL this Subject's Topics and Quizzes for this Term!
Click on the button "Subscribe Now" below for Full Access!
Subscribe Now
Note: If you have Already Subscribed and you are seeing this message, it means you are logged out. Please Log In using the Login Button Below to Carry on Studying!


Thumbs up,man! What a great work?
Thanks, Chux! 🙂
thanks alot